How to Reduce Labor Costs in Your Cleaning Business
Labor is the biggest expense in any cleaning business. Learn how accurate time tracking reveals hidden waste and helps you cut costs without cutting quality or losing your team.
Labor Is 50–70% of Your Costs. Here’s Where It Leaks.
Labor costs don’t blow up all at once. They leak — slowly, in small increments, across dozens of sites. And without per-site data, you can’t see where.
Time padding — ten minutes on each end of a shift, across a twenty-person crew, adds up to ~$25,000/year at $15/hour. It’s not malicious. It’s just invisible without precise clock-in data.
Avoidable overtime — a route that consistently runs 9 hours generates OT every week. Split it and two cleaners handle it in 4.5 hours each. Same work, lower cost.
Overstaffed sites — two cleaners on a job one person could handle. Nobody re-evaluated after the scope changed.
Unprofitable contracts — bids that were wrong from the start, scope that grew without a price adjustment. Without per-client hour tracking, these contracts hide in plain sight.
Inefficient routes — thirty minutes of paid drive time that could be ten with better clustering.
Payroll errors — manual timesheets produce overpayments and underpayments. Both cost money. One directly, the other through back-pay obligations and FLSA exposure.
How to Find and Fix Each One
Time tracking doesn’t automatically reduce costs. It gives you visibility to make targeted changes. Here’s what to do with the data.
Find the sites that cost more than they should. Tag every clock-in to a client location, then compare actual labor cost to contract revenue. A site that costs $600/month in labor but pays $550? That’s a renegotiation, a re-scope, or a reassignment.
Catch overtime patterns early. Weekly data shows which cleaners consistently hit OT and which routes cause it. Don’t accept it as a cost of doing business — restructure routes to distribute hours more evenly. Moving one job site from an overloaded route to a lighter one can eliminate hours of weekly overtime.
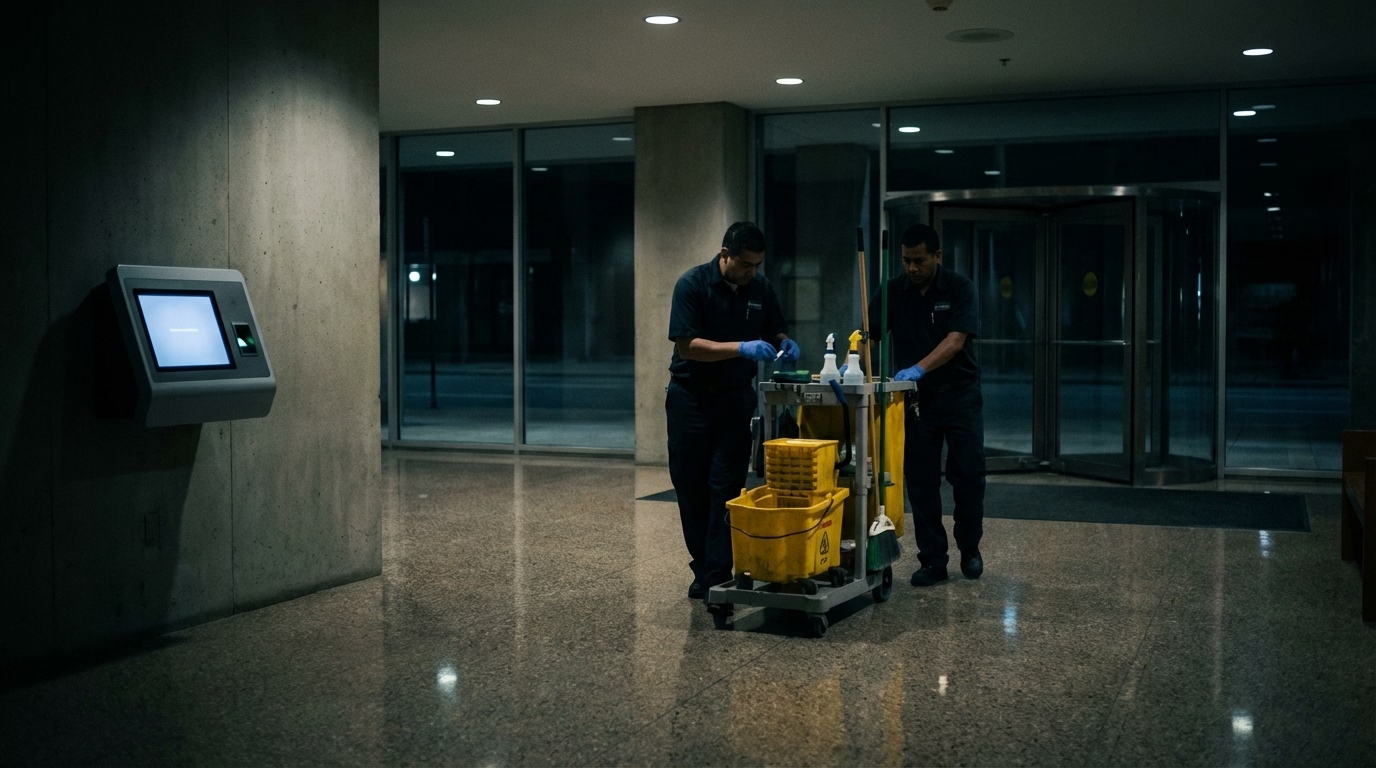
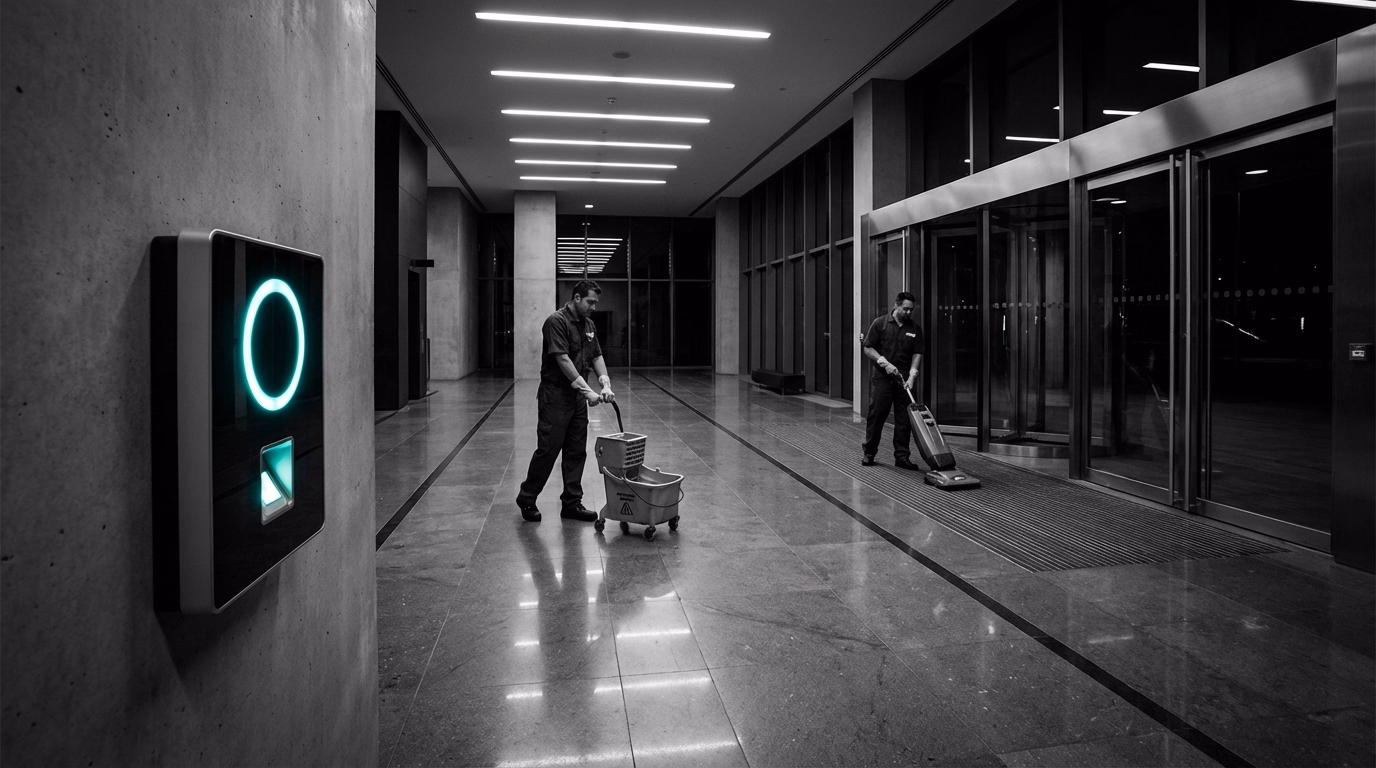
Kill habitual time padding. GPS verification and geofencing mean cleaners can’t clock in from the parking lot ten minutes early. Won’t catch everything, but it eliminates the easy, habitual kind that compounds over a year.
Right-size your crews. Two cleaners finishing a site in 1.5 hours each = 3 total labor hours. One cleaner finishing in 2.5 hours = same result, one team member freed up. Test it where the data supports it.
Optimize routes with travel data. The gap between clock-out at one site and clock-in at the next tells you exactly how much labor cost is going to driving. Reorganize to minimize it.
Price new bids on real data. Your historical per-site hours are the best bidding tool you have. A 10,000-sq-ft medical office averages 3.5 hours per visit? Price the next similar bid accordingly. For a step-by-step process, see our guide on bidding cleaning contracts with time data.
Let’s Do the Math
None of this requires cutting staff or reducing quality. It’s about seeing what’s happening and making smarter decisions.
- Trim ten minutes of padding per shift, twenty-person crew, five days a week → 860+ hours/year → ~$13,000
- Redistribute four hours of weekly OT to regular time across two routes → ~$1,560/year
- Renegotiate two unprofitable contracts from loss to break-even → $5,000–$10,000/year
Combined: 5–15% of total labor costs recovered, without a single layoff.

Where to Start
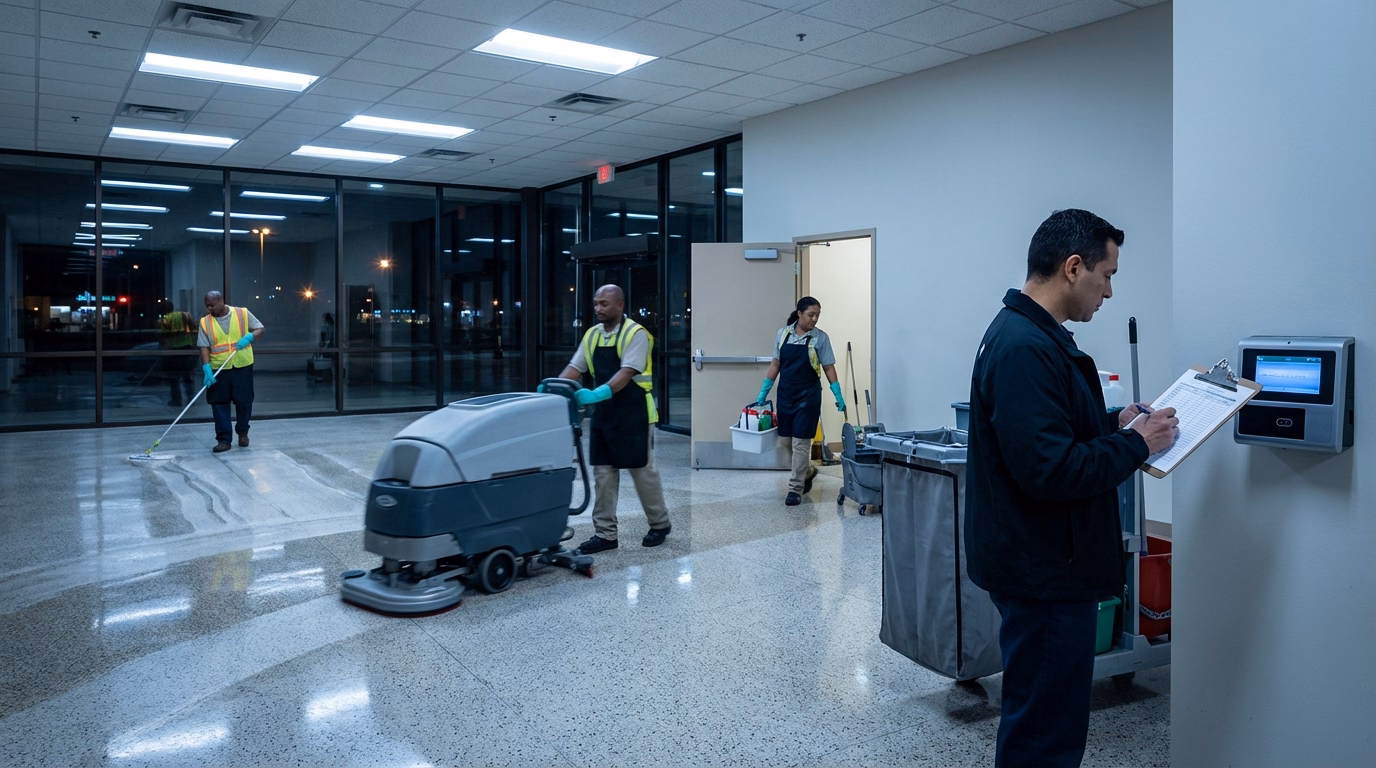
Step 1: Get accurate per-site time data. You can’t fix what you can’t see.
Step 2: Calculate your effective hourly rate for each client. Find the bottom performers.
Step 3: Look at overtime patterns. Which cleaners hit OT regularly? Which routes cause it?
Step 4: Review crew sizes. Any sites overstaffed?
Step 5: Track travel time between sites. Look for clustering opportunities.
Every step depends on accurate data. If you’re still working from paper timesheets, the numbers aren’t reliable enough to act on. A time clock that tracks hours by client location gives you the visibility to find the waste and turn revenue growth into actual profit.
Frequently Asked Questions
What percentage of cleaning business expenses is labor?
Typically 50–70%, depending on the type of work and geographic market. It’s by far the largest cost category — and the one with the most room for optimization if you have the data to see where the money’s going.
How does time tracking reduce labor costs in a cleaning business?
It gives you visibility into where labor dollars actually go. Per-site data reveals overstaffed sites, time padding, avoidable overtime, unprofitable contracts, and inefficient routes. You can’t fix what you can’t see — and most cleaning businesses are working blind without per-client hour data.
Can you reduce cleaning labor costs without cutting staff?
Yes. Most savings come from eliminating waste, not headcount: reducing overtime through better scheduling, cutting time padding with GPS/geofencing, right-sizing crews at overstaffed sites, optimizing routes, and fixing payroll errors from inaccurate timesheets. These changes typically save 5–15% without reducing service quality.
How do I know if my cleaning contracts are profitable?
Divide each contract’s monthly revenue by the actual monthly labor hours. That gives you your effective hourly rate. If it doesn’t cover your fully loaded labor cost (wages + taxes + insurance + supplies + overhead), the contract is losing money. Per-client time tracking is the only way to get this number.