
How Much Does a Handyman Make?
How much does a handyman make? See the closest May 2025 employee benchmark, hourly and annual pay, state salaries, job fit, and offer comparisons for employees.
The closest official employee benchmark for handyman pay has a median wage of $23.84 per hour, or $49,590 per year, according to May 2025 federal wage data. That is about $954 per week or $4,133 per month before tax when the annual figure is divided evenly across 52 weeks or 12 months.
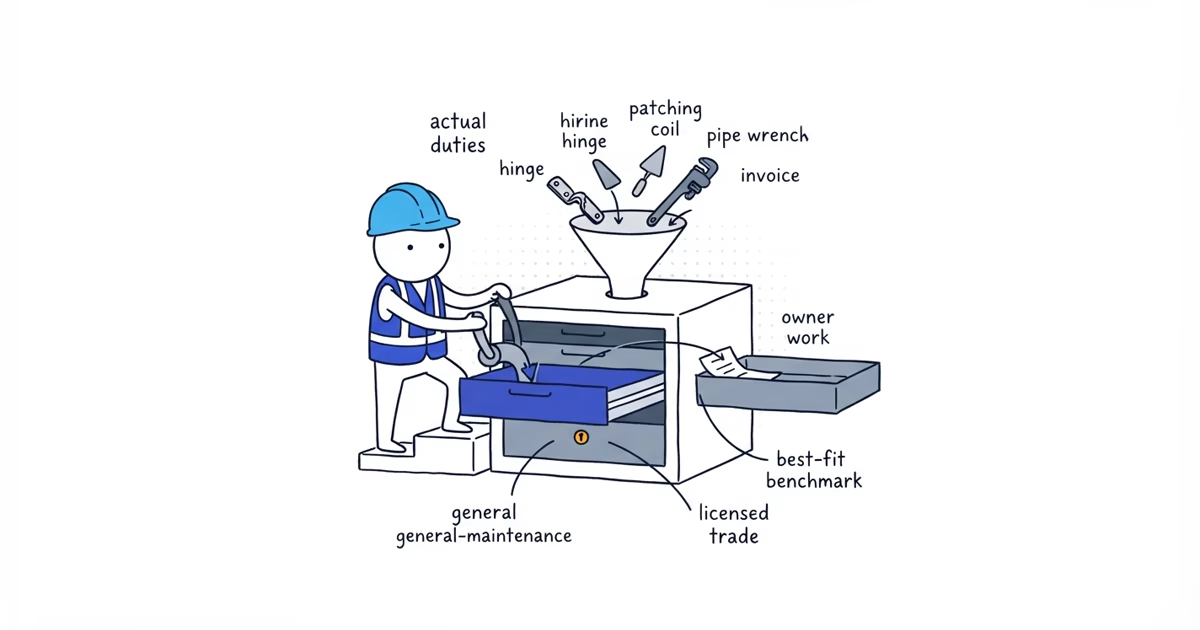
There is an important catch: the Bureau of Labor Statistics does not publish an occupation called Handyman. The figures in this guide are for Maintenance and Repair Workers, General (SOC 49-9071). They fit many employed handyman jobs, but not every job advertised under that title. If you run an independent operation, use the handyman business owner earnings guide to model billable hours, collected jobs, costs, owner compensation, and retained cash instead of treating the employee benchmark as owner income.
Does the handyman salary benchmark fit your job?
The job title on a posting is not enough. A hotel maintenance employee, an independent home-repair operator, and a licensed electrician may all be described casually as a handyman, but they do not belong in one wage comparison.
Use the work itself as the test:
| What the job actually looks like | Does SOC 49-9071 fit? | Better comparison when it does not fit |
|---|---|---|
| An employee handles routine repairs and upkeep across several building systems | Usually | Use the national and state employee medians below |
| An employee maintains apartments, a hotel, a school, or a commercial property | Often | Confirm the role is general maintenance rather than supervision |
| A self-employed operator makes residential service calls and invoices customers | No | Model business collections, costs, and owner compensation |
| A contractor mainly performs remodels or larger construction projects | Usually not | Use the occupation and business model that match that work |
| The job mainly involves regulated electrical, plumbing, HVAC, or another specialty | No | Use the relevant specialty-trade occupation |
| A first-line supervisor mainly directs maintenance workers | No | Use the supervisory occupation |
SOC 49-9071 covers workers who keep machines, mechanical equipment, or the structure of an establishment in repair. O*NET tasks include diagnosing problems, planning repairs, using common hand and power tools, replacing defective parts, and performing routine preventive maintenance. That overlap is why it is a useful employee benchmark for many general-maintenance and employed handyman roles.
It stops being a good fit when the worker’s main job belongs to a separately classified trade, when the person mostly supervises others, or when the person owns the operation and bills customers. Make that decision before comparing a job offer with any of the figures below.
Handyman hourly pay and wage percentiles
The May 2025 wage distribution for Maintenance and Repair Workers, General covered an estimated 1,529,700 wage and salary jobs nationwide.
| Percentile | Hourly wage | Annual wage | What the percentile means |
|---|---|---|---|
| 10th | $17.00 | $35,350 | 10% earned this amount or less |
| 25th | $19.64 | $40,840 | 25% earned this amount or less |
| 50th | $23.84 | $49,590 | The median: half earned less and half earned more |
| 75th | $30.10 | $62,620 | 25% earned this amount or more |
| 90th | $37.11 | $77,180 | 10% earned this amount or more |
The middle half of wages ran from $19.64 to $30.10 per hour. That is a wage distribution, not a career ladder. The 10th percentile is not an official beginner rate, and the 90th percentile is not a master-handyman rate. The dataset does not tell us each worker’s tenure, credentials, employer, duties, or local labor conditions.
The $954 weekly and $4,133 monthly figures are simple conversions of the annual median. They are useful for budgeting, but they are not promises of guaranteed hours in every week or equal checks in every month.
How to compare a handyman job offer
Once the occupation fits, compare the offer in two layers. First compare its straight-time base wage with the national median and the median for the state. Then build the paid year the employer is actually offering.
Two hypothetical offers show why both layers matter:
| Offer | Base wage | Expected paid schedule | Straight-time base for that schedule |
|---|---|---|---|
| Stable full-year maintenance schedule | $25.00 | 40 hours x 50 weeks | $50,000 |
| Higher rate with interrupted schedules | $27.00 | 34 hours x 45 weeks | $41,310 |
These are arithmetic examples, not market forecasts. They show why a rate above the median can still produce less base pay over the year when paid hours are inconsistent.
Ask what counts as paid time, whether hours are guaranteed, and how evenings, weekends, on-call work, or seasonal gaps are handled. Then price the rest of the offer separately: overtime policy, bonuses, paid time off, health coverage, retirement contributions, tools, mileage, and other benefits.
OEWS wages are straight-time gross pay. They do not include overtime premiums, shift differentials, nonproduction bonuses, severance, employer benefit costs, or tuition reimbursement. The survey also excludes self-employed workers and owners or partners of unincorporated firms. That is why neither customer rates nor owner take-home belongs in this wage table.
Do handymen need a license?
There is no single national handyman license rule. State and local requirements can depend on the task, project value, permit, and whether the work falls inside a regulated specialty. Check the relevant licensing and permitting authorities for the jurisdiction and the actual work in the job description. A broad title does not authorize specialty work.
Handyman salary by state
The District of Columbia had the highest published state or district median for this occupation at $60,310 per year, narrowly ahead of Alaska at $60,270 and Minnesota at $59,200. Every row below uses the same May 2025 release and the same occupation proxy.
| Rank | State or district | Median annual | Median hourly |
|---|---|---|---|
| 1 | District of Columbia | $60,310 | $29.00 |
| 2 | Alaska | $60,270 | $28.97 |
| 3 | Minnesota | $59,200 | $28.46 |
| 4 | Washington | $59,160 | $28.44 |
| 5 | Massachusetts | $58,320 | $28.04 |
| 6 | Hawaii | $57,960 | $27.86 |
| 7 | New York | $57,790 | $27.79 |
| 8 | Connecticut | $57,620 | $27.70 |
| 9 | California | $57,000 | $27.41 |
| 10 | Illinois | $56,720 | $27.27 |
| 11 | Wisconsin | $55,810 | $26.83 |
| 12 | Vermont | $55,510 | $26.69 |
| 13 | New Jersey | $54,810 | $26.35 |
| 14 | Oregon | $54,350 | $26.13 |
| 15 | Ohio | $53,420 | $25.68 |
| 16 | New Hampshire | $52,830 | $25.40 |
| 17 | Nevada | $52,360 | $25.17 |
| 18 | Iowa | $52,160 | $25.08 |
| 19 | Maryland | $51,490 | $24.76 |
| 20 | Colorado | $51,280 | $24.65 |
| 21 | Rhode Island | $50,900 | $24.47 |
| 22 | Nebraska | $50,700 | $24.38 |
| 23 | Utah | $50,450 | $24.26 |
| 24 | Delaware | $50,150 | $24.11 |
| 25 | Indiana | $49,890 | $23.99 |
| 26 | North Dakota | $49,840 | $23.96 |
| 27 | Virginia | $49,470 | $23.79 |
| 28 | Maine | $49,430 | $23.76 |
| 29 | Pennsylvania | $49,290 | $23.70 |
| 30 | Missouri | $48,370 | $23.26 |
| 31 | Idaho | $48,190 | $23.17 |
| 32 | South Dakota | $48,100 | $23.13 |
| 33 | North Carolina | $47,910 | $23.03 |
| 34 | Wyoming | $47,900 | $23.03 |
| 35 | South Carolina | $47,880 | $23.02 |
| 36 | Georgia | $47,680 | $22.92 |
| 37 | Arizona | $47,620 | $22.90 |
| 38 | Michigan | $47,580 | $22.87 |
| 39 | Tennessee | $47,240 | $22.71 |
| 40 | Kansas | $47,210 | $22.70 |
| 41 | Montana | $46,870 | $22.54 |
| 42 | Kentucky | $46,810 | $22.50 |
| 43 | Texas | $46,670 | $22.44 |
| 44 | Florida | $46,060 | $22.15 |
| 45 | New Mexico | $45,760 | $22.00 |
| 46 | Mississippi | $44,350 | $21.32 |
| 47 | Louisiana | $43,960 | $21.13 |
| 48 | Alabama | $43,630 | $20.97 |
| 49 | Arkansas | $43,400 | $20.87 |
| 50 | Oklahoma | $42,750 | $20.55 |
| 51 | West Virginia | $38,890 | $18.70 |
The state ranking compares nominal wages. It does not adjust for housing, taxes, travel, benefits, or other living and working costs, and the data do not prove why one state is above another.
The final comparison is simple: match the duties first, then compare the base wage with both the national and state employee medians, and finally build the paid year and benefits separately. If the role invoices customers instead of paying an employee wage, move to the owner model rather than forcing business income into an employee salary table.
Frequently asked questions
Are self-employed handymen included in handyman salary data?
No. The OEWS figures in this guide cover wage-and-salary employees in the closest general-maintenance occupation. An independent handyman needs a business model that subtracts nonbillable time, direct costs, and overhead before owner compensation.
What should a handyman charge per hour?
A customer rate is business pricing, not an employee wage. The $23.84 figure in this guide is an employee benchmark; independent pricing also has to cover travel, estimates, supply runs, callbacks, operating costs, and retained cash.
Sources
- BLS May 2025 Occupational Employment and Wage Statistics
- My Next Move national wage table for Maintenance and Repair Workers, General
- My Next Move state wage lookup for Maintenance and Repair Workers, General
- O*NET profile for Maintenance and Repair Workers, General
- BLS Occupational Outlook Handbook for General Maintenance and Repair Workers
- BLS OEWS technical notes
- CareerOneStop License Finder
- handyman
- handyman-salary
- hourly-pay
- salary-by-state
- employee-wages