
How Much Does a Pest Control Technician Make?
How much does a pest control technician make? Compare May 2025 hourly and annual pay, wage percentiles, state salaries, commission, licensing, and job offers.
The median wage for US pest control technicians was $21.75 per hour, or $45,250 per year, in May 2025. That works out to about $870 per week or $3,771 per month when the official annual figure is divided by 52 or 12.
That median is a useful reference, but it does not settle a job-offer comparison. A higher posted rate can still produce a smaller straight-time year if it comes with fewer paid hours, and an incentive only counts when its formula and conditions are clear.
Those figures cover Pest Control Workers (SOC 37-2021) in wage-and-salary jobs. The occupation includes reported titles such as pest control technician, exterminator, termite technician, applicator, and pest control operator. It does not include self-employed workers. If you own the route or company, use the pest control business owner earnings guide to work from retained accounts, collections, route costs, owner compensation, and retained cash.
Pest control technician hourly pay and wage percentiles
The May 2025 federal estimate covered 102,620 employed pest control workers. The median is the middle observation, not an estimate for a particular license or experience level.
| Percentile | Hourly wage | Annual wage | What the percentile means |
|---|---|---|---|
| 10th | $16.67 | $34,680 | 10% earned this amount or less |
| 25th | $18.00 | $37,440 | 25% earned this amount or less |
| 50th | $21.75 | $45,250 | The median: half earned less and half earned more |
| 75th | $23.85 | $49,600 | 25% earned this amount or more |
| 90th | $29.75 | $61,890 | 10% earned this amount or more |
The middle half of the distribution ran from $18.00 to $23.85 per hour. These figures do not say that the 10th percentile is a trainee, the median is a licensed technician, or the 90th percentile is a supervisor. The published rows do not identify the license, route, employer, service mix, incentive plan, or experience behind each wage.
The national mean was $22.31 per hour, or $46,400 per year. The mean adds every reported wage and divides by the number of workers, so higher values pull it upward. The median is the cleaner reference for the worker in the middle.
The weekly and monthly conversions are planning equivalents, not promised checks. The actual year depends on paid hours and the offer’s overtime and incentive terms.
What pest control technician salary includes and excludes
OEWS uses straight-time gross pay. It includes base pay and incentive pay such as commissions and production bonuses. It excludes overtime premium pay, employer benefit costs, and reimbursements.
The public table does not split the median into base and variable pay, so do not add an assumed commission percentage to $21.75. For an actual offer, keep three lanes separate:
- Guaranteed straight-time pay: the hourly base multiplied by realistic paid hours.
- Variable pay: commission or production bonus calculated from the written plan and a defensible workload.
- Compensation outside the wage: overtime premium, benefits, vehicle support, paid training, and employer-paid licensing or equipment.
Until the incentive formula can be tested against a realistic route, it belongs in the variable lane rather than the guaranteed one.
Pest control licensing and technician pay
Federal law requires a person who applies or supervises the use of restricted-use pesticides to be certified under EPA rules and the applicable state, territorial, or tribal laws. The EPA also notes that many states require commercial applicators to be certified even when they are not using restricted-use pesticides. The responsible authority and requirements therefore depend on where the work is performed.
California shows why a national license ladder would be misleading. Its Structural Pest Control Board describes an Applicator license for Branch 2 and Branch 3 work on behalf of a registered company. A Field Representative can inspect, identify infestations, submit bids, and secure work for a registered company. An Operator can perform similar duties and may own a company or act as its qualifying manager. Those are California license types, not national career stages.
A license, added inspection duty, sales responsibility, termite work, commercial route, or supervisory role can change an individual offer. The reviewed official sources do not establish one nationwide dollar premium for any of them. Ask what the role requires and how the employer pays for that responsibility rather than assigning the job to a higher percentile by title alone.
How to compare a pest control job offer
Start with the pay that does not depend on a sale, production threshold, or perfect route. Then add conditional pay one line at a time.
Consider two hypothetical schedules before incentives:
| Offer | Hourly base | Expected paid schedule | Straight-time base for that schedule |
|---|---|---|---|
| Lower rate with steadier paid hours | $20.00 | 40 hours x 50 weeks | $40,000 |
| Higher rate with fewer paid hours | $23.00 | 34 hours x 48 weeks | $37,536 |
The $23 offer has the larger hourly number but the smaller straight-time year under these assumptions. That does not make either offer better. It shows why the expected paid schedule has to be checked before commission, overtime, and benefits are added.
Use this pest-control job-offer test:
| Offer item | What to ask | How to compare it |
|---|---|---|
| Guaranteed base | Is the rate hourly or salaried, and are minimum weekly hours promised? | Build the straight-time year from realistic paid hours |
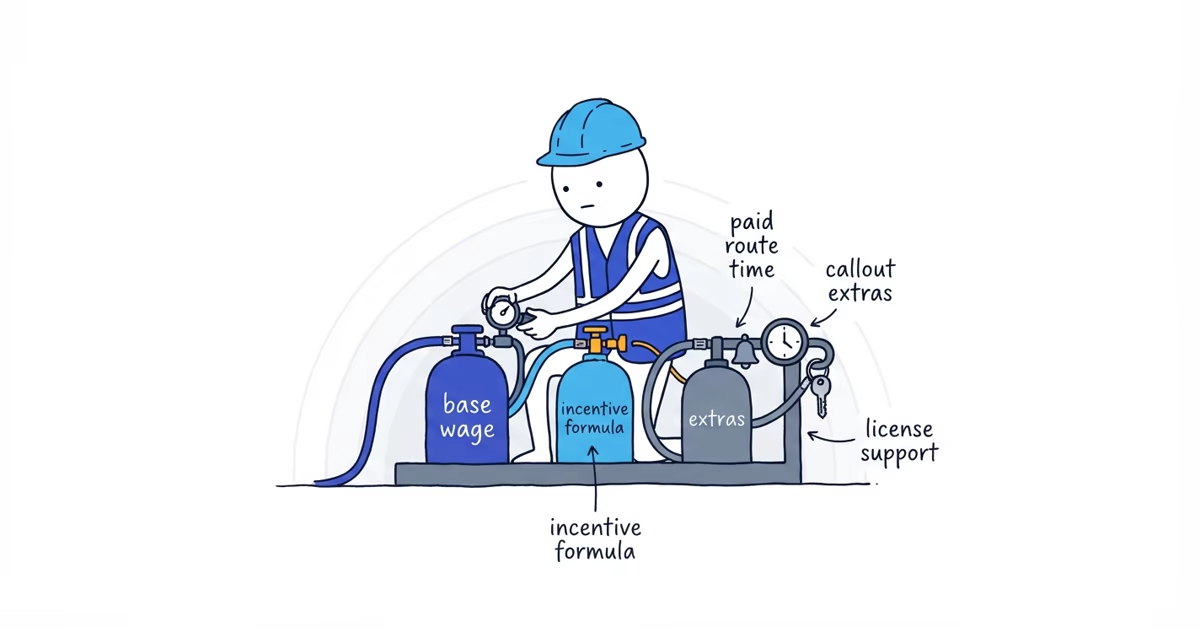
| Incentive formula | Is pay tied to production, service revenue, sales, collections, or retention? | Calculate it from the written formula; keep it variable |
| Thresholds and reversals | Is there a minimum target, cap, callback deduction, cancellation, or clawback? | Test a normal month and a weak month |
| Paid route time | Are driving, meetings, loading, paperwork, and customer follow-up paid? | Count all paid time, not only time at the stop |
| Callbacks | Who handles reservice, and does it affect hours or incentive credit? | Put the time and any pay adjustment into the comparison |
| Overtime | How often is overtime available and what premium applies? | Keep it outside the straight-time base |
| Vehicle and field costs | Does the employer provide the vehicle, fuel, phone, PPE, and equipment? | Treat avoided employee costs separately |
| Licensing and training | Who pays application, exam, renewal, continuing education, and training time? | Compare both cash cost and paid time |
| Benefits and time off | What health, retirement, paid leave, and holiday benefits are included? | Compare the actual employer offer, not a guessed value |
| Route and sales duties | Is the role service-only, inspection-led, sales-led, or mixed? | Compare jobs with similar duties before using the wage |
Do not fill an empty incentive-plan field with a recruiter’s best month. Ask for the formula, the measurement period, what happens to callbacks or cancellations, and an example pay statement with private information removed. If the employer cannot show how variable pay becomes earned pay, compare the offer on guaranteed base and paid hours only.
Pest control technician salary by state
Washington had the highest published state median at $51,300 per year, followed by South Dakota at $49,920 and Nevada at $49,240. The May 2025 release published medians for all 50 states but no District of Columbia row for this occupation. California published a wage median but suppressed its statewide employment estimate.
| Rank | State | Median annual | Median hourly |
|---|---|---|---|
| 1 | Washington | $51,300 | $24.66 |
| 2 | South Dakota | $49,920 | $24.00 |
| 3 | Nevada | $49,240 | $23.67 |
| 4 | Connecticut | $49,010 | $23.56 |
| 5 | New Jersey | $48,780 | $23.45 |
| 6 | Colorado | $48,650 | $23.39 |
| 7 | Hawaii | $48,570 | $23.35 |
| 8 | New York | $48,530 | $23.33 |
| 9 | Maine | $48,340 | $23.24 |
| 10 | North Dakota | $48,020 | $23.09 |
| 11 | New Hampshire | $48,000 | $23.08 |
| 12 | Maryland | $47,360 | $22.77 |
| 13 | California | $47,190 | $22.69 |
| 14 | Alaska | $46,900 | $22.55 |
| 15 | Oregon | $46,570 | $22.39 |
| 16 | Illinois | $46,450 | $22.33 |
| 17 | Vermont | $46,320 | $22.27 |
| 18 | Virginia | $45,950 | $22.09 |
| 19 | Pennsylvania | $45,720 | $21.98 |
| 20 | Massachusetts | $45,560 | $21.90 |
| 21 | Wisconsin | $45,350 | $21.81 |
| 22 | Delaware | $45,300 | $21.78 |
| 23 | Iowa | $45,290 | $21.78 |
| 24 | Rhode Island | $45,030 | $21.65 |
| 25 | Utah | $44,740 | $21.51 |
| 26 | North Carolina | $44,740 | $21.51 |
| 27 | Louisiana | $44,570 | $21.43 |
| 28 | Wyoming | $44,500 | $21.40 |
| 29 | Michigan | $44,470 | $21.38 |
| 30 | Arizona | $44,430 | $21.36 |
| 31 | Florida | $44,320 | $21.31 |
| 32 | South Carolina | $43,130 | $20.73 |
| 33 | Missouri | $42,690 | $20.53 |
| 34 | Kentucky | $42,310 | $20.34 |
| 35 | Montana | $41,730 | $20.06 |
| 36 | Minnesota | $41,640 | $20.02 |
| 37 | Idaho | $40,220 | $19.34 |
| 38 | Ohio | $40,110 | $19.28 |
| 39 | Tennessee | $39,690 | $19.08 |
| 40 | Oklahoma | $39,050 | $18.77 |
| 41 | Nebraska | $38,960 | $18.73 |
| 42 | Kansas | $38,690 | $18.60 |
| 43 | Indiana | $38,600 | $18.56 |
| 44 | Alabama | $38,410 | $18.47 |
| 45 | Georgia | $37,860 | $18.20 |
| 46 | Arkansas | $37,710 | $18.13 |
| 47 | Texas | $37,660 | $18.11 |
| 48 | West Virginia | $37,510 | $18.03 |
| 49 | Mississippi | $37,200 | $17.89 |
| 50 | New Mexico | $37,070 | $17.82 |
The ranking uses nominal wages. It does not adjust for living costs or explain differences in route density, pest mix, seasonality, licensing, benefits, or incentive plans. Use the state row as a reference, not as a substitute for the actual duties and offer.
Price the offer from guaranteed pay outward. Build a realistic paid year from the base rate and paid hours, then add the written incentive formula, overtime, employer-paid field costs, training, and benefits as separate lines.
Frequently asked questions
Is commission included in pest control technician salary data?
OEWS includes incentive pay such as commissions and production bonuses in its wage definition. The published median does not reveal how much of the pay came from base rate or incentive pay, so do not add an assumed commission to it.
How much does a licensed pest control technician make?
The reviewed official sources do not publish one national pay premium for a pest control license. Licensing categories and duties vary by state, so compare the actual role, required credentials, paid hours, and compensation plan rather than assigning licensed technicians to a higher percentile.
Are self-employed pest control technicians included?
No. OEWS excludes self-employed workers and owners or partners of unincorporated firms. A self-employed operator needs an account, collection, cost, owner-compensation, and retained-cash model rather than an employee wage table.
Sources
- pest-control
- technician-salary
- hourly-pay
- salary-by-state
- employee-wages