How Much Do Pest Control Business Owners Make?
How much do pest control business owners make? Model recurring revenue, churn, route capacity, payroll, owner compensation, and retained cash for one year.
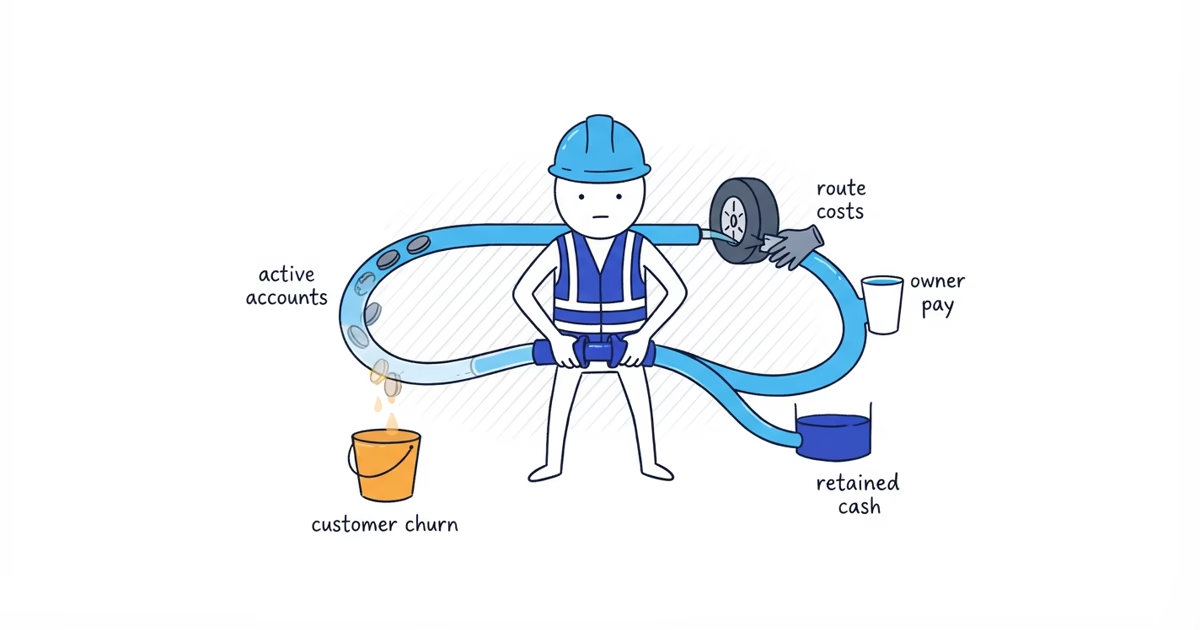
There is no defensible national average for pest control business owner pay. In the owner-operated route model below, $155,200 in annual collections supports $75,738 in planned owner compensation and leaves $18,934 in the business.
That is an illustration, not a market benchmark. The owner runs the route, handles sales and admin, and takes the risk in this example. Change the active accounts, churn, service frequency, collections, costs, or owner role and the result changes with them.
A full route is not the same thing as retained recurring revenue.
How active accounts drive pest control owner income
The current account count is a snapshot. Owner pay needs a bridge that shows what happened during the year:
Opening active accounts + new recurring starts - churned accounts = ending active accounts
The average of opening and ending accounts is a simple planning estimate for the account base carried through the year. That average then drives recurring revenue:
Average active accounts x planned visits x completion/collection factor x collected price = recurring revenue
Initial services and one-time treatments stay on separate lines. That prevents a high initial charge or a strong one-time month from being mistaken for recurring route value.
Here is the active-account bridge for the owner-operated residential route:
| Account movement | Model value |
|---|---|
| Opening active accounts | 220 |
| New recurring starts | 100 |
| Churned accounts | -60 |
| Ending active accounts | 260 |
| Average active accounts | 240 |
The model then applies five planned recurring visits per account, a 97% combined completion/collection factor, a $105 collected recurring price, a $190 collected initial-service price, and 60 one-time jobs at a $250 collected ticket:
- Recurring service:
240 x 5 x 97% x $105 = $122,220 - Initial services:
100 x 97% x $190 = $18,430 - One-time work:
60 x 97% x $250 = $14,550 - Total collected revenue: $155,200
The 97% factor is a disclosed planning assumption, not a pest-control benchmark. If the business records completion and bad debt separately, use both records instead of combining them.
This route produces about 1,319 completed and collected service units in the model. Across 48 service weeks, that is roughly 27.5 stops per week, or 5.5 per five-day route day. The owner still has to fit sales, scheduling, supplies, vehicle care, records, and customer issues around that field schedule.
Pest control business revenue and owner pay
Once route revenue is visible, the next question is where the cash goes. These six labels keep customer money, operating cash, owner pay, and business cash from collapsing into one number:
| Term | Meaning |
|---|---|
| Recurring revenue | Collected money from planned visits to retained active accounts |
| Total collected revenue | Recurring, initial-service, and one-time customer money received |
| Technician payroll | Loaded non-owner labor cost, including paid time that may not create a customer stop |
| Cash before owner compensation | Collections after technician payroll and the modeled operating costs |
| Owner compensation | The selected share of pre-owner cash allocated to the owner’s field and ownership work |
| Retained cash | The share left in the business after the owner allocation |
The model does not decide whether owner compensation is paid as payroll, a draw, a distribution, or a combination. That depends on entity and tax facts outside this article.
Pest control business owner income examples
The three examples below are operating shapes, not low, average, and high income tiers. Every input is an editorial planning assumption rather than a published pest-control benchmark.
The owner-operated route has no employee payroll. The owner performs the field work and handles sales, scheduling, records, and management. In owner plus one technician, the owner still works about two route days each week and handles sales and administration while the technician carries the main route. In two-technician routes, the owner is mostly off route but provides sales, scheduling, management, and about one route day of coverage each week.
| Annual input | Owner-operated route | Owner + one technician | Two-technician routes |
|---|---|---|---|
| Opening active accounts | 220 | 500 | 900 |
| New recurring starts | 100 | 180 | 300 |
| Churned accounts | 60 | 140 | 220 |
| Ending active accounts | 260 | 540 | 980 |
| Average active accounts | 240 | 520 | 940 |
| Recurring visits per account | 5 | 4 | 4 |
| Completion/collection factor | 97% | 97% | 97% |
| Collected recurring price | $105 | $115 | $120 |
| Collected initial-service price | $190 | $210 | $220 |
| One-time jobs / collected ticket | 60 / $250 | 100 / $275 | 180 / $300 |
| Loaded technician payroll | $0 | $62,000 | $132,000 |
| Materials and callback allowance | 9% | 9% | 10% |
| Vehicle and route cost | 10% | 12% | 12% |
| Marketing | 8% | 8% | 9% |
| Insurance, licenses, training, and admin | 12% | 11% | 13% |
| Share of pre-owner cash allocated | 80% | 75% | 65% |
Loaded technician payroll is a fixed annual model input, not a percentage of revenue. The other cost rows are applied to collected revenue. The final line deliberately retains a larger share of pre-owner cash as the modeled team grows.
| Annual model output | Owner-operated route | Owner + one technician | Two-technician routes |
|---|---|---|---|
| Collected recurring revenue | $122,220 | $232,024 | $437,664 |
| Initial-service revenue | $18,430 | $36,666 | $64,020 |
| One-time revenue | $14,550 | $26,675 | $52,380 |
| Total collected revenue | $155,200 | $295,365 | $554,064 |
| Technician payroll | $0 | -$62,000 | -$132,000 |
| Materials and callbacks | -$13,968 | -$26,583 | -$55,406 |
| Vehicle and route cost | -$15,520 | -$35,444 | -$66,488 |
| Marketing | -$12,416 | -$23,629 | -$49,866 |
| Insurance, licenses, and admin | -$18,624 | -$32,490 | -$72,028 |
| Cash before owner pay | $94,672 | $115,219 | $178,276 |
| Planned owner compensation | -$75,738 | -$86,414 | -$115,879 |
| Retained cash | $18,934 | $28,805 | $62,397 |
The two-technician business collects more than three times the owner-operated route, but modeled owner compensation is not three times as large. Technician payroll and a larger operating cost base absorb cash, and this example retains 35% of pre-owner cash rather than 20%.
Personal tax, debt principal, owner benefits, major vehicle or equipment purchases beyond the modeled allowances, and any required tax or operating reserve beyond retained cash are outside the table. Add them before treating an output as spendable owner pay.
How route density affects pest control owner income
Two routes with 500 active accounts can require very different paid hours. The useful capacity measure is completed stops per route-day, after loading, driving, inspection, documentation, customer contact, and callbacks have taken their time.
The owner-plus-one-technician example produces about 2,289 completed service units, or about 46 per week across 50 route weeks. A rough capacity check gives the owner two field days and the technician five, but the actual stops, drive time, service mix, and callback record still have to prove that those seven route-days are enough.
The two-technician example needs roughly 82 service units per week. Two technicians averaging 7.5 stops on each of five route days create capacity for 75, so the owner’s modeled route-coverage day supplies the balance. Coming fully off the route means replacing that capacity; the revenue table does not create it.
Callbacks can consume a route slot and add chemical, fuel, or labor cost. A cost allowance does not restore the lost capacity, so material callback visits and costs need their own record.
How customer churn affects pest control revenue
The owner-plus-one-technician example opens with 500 accounts, adds 180, loses 140, and ends at 540. Its simple average active base is 520.
If churn rose by 40 accounts while every other input stayed still, the business would end at 500 and average 500 active accounts. Modeled recurring collections would fall by $8,924:
20 fewer average accounts x 4 visits x 97% x $115 = $8,924
That is the recurring-revenue effect only. Vehicle, insurance, software, licensing, and office costs may not fall with it. Replacing those 40 accounts would also require new starts and the marketing or sales work behind them.
The same one-input test can expose other assumptions. At 520 average accounts, a $5 change in collected recurring price changes annual recurring revenue by $10,088 before costs; a three-point decline in the completion/collection factor reduces it by $7,176. Those are arithmetic sensitivities, not pricing or collection targets.
If the collected-price input is still a guess, use the pest-control pricing guide to build the initial treatment, recurring visit, re-service reserve, and first-year customer price before carrying it into the owner-income model.
Why there is no average pest control owner salary
The 2023 Census Nonemployer Statistics extract reports 16,137 establishments without paid employees in Exterminating and Pest Control Services, NAICS 561710, with $867.188 million in aggregate receipts.
Dividing receipts by establishments produces about $53,739 per establishment. That is an arithmetic result, not a published median. It includes businesses of different sizes and activity levels, measures receipts before expenses, and covers establishments with no paid employees. It does not measure owner compensation, retained cash, a typical full-time route, or the employer businesses represented in the team scenarios above.
The value of the Census row is its boundary. It confirms a specific pest-control nonemployer industry and shows why public receipts cannot answer the owner-pay question. The account and cash model still has to do that work.
If you need an employee-pay benchmark for field work, use the pest control technician salary guide to compare May 2025 wages without substituting an employee wage for the return on owning a route or company.
How to calculate pest control owner compensation
Use one trailing-12-month period so account movement, route records, collections, payroll, and expenses describe the same year.
- Reconcile opening and ending active accounts with new starts, cancellations, paused accounts, and actual churn.
- Match planned and completed recurring visits, initial services, callbacks, and one-time jobs to customer money collected in the same period; calculate a collected price for each service type.
- Test route capacity against every paid technician hour, including driving, meetings, training, callbacks, and other time that does not create a customer stop.
- Total loaded payroll, materials, vehicles and fuel, insurance, licensing and training, software and admin, marketing, office payroll, merchant fees, and callback costs.
- Subtract those costs from collections, set the cash the business must retain, and only then allocate compensation for the owner’s field and ownership work.
Reconcile account movement, completed services, collections, costs, and retained cash for one trailing year. The largest account number shown in the software cannot do that work.
Frequently asked questions
How profitable is a pest control business?
The reviewed public sources do not provide a representative national profit benchmark. Calculate it from retained accounts, completed and collected services, loaded payroll, route and operating costs, the owner’s working role, and the cash the business must keep.
How many stops should a pest control route complete per day?
There is no universal stops-per-day target in the reviewed sources. Use completed stops per route-day after loading, driving, inspection, documentation, and callbacks; the disclosed capacity examples are planning checks, not industry benchmarks.
Is recurring pest control contract value the same as revenue?
No. The model uses average active accounts, completed visits, a completion/collection factor, and collected price. Future scheduled service and canceled or unpaid work are not available owner cash.
Sources
- pest-control
- business-owner-earnings
- owner-compensation
- route-revenue
- customer-churn