
How Much Does a Plumber Make?
Plumbers earn a median $30.67 per hour and $63,800 per year. Compare the pay range and median wages across every U.S. state.
The national median plumber salary is $30.67 per hour, or $63,800 per year, according to the latest U.S. Bureau of Labor Statistics wage data. That is approximately $1,227 per week or $5,317 per month when the official annual median is divided by 52 or 12.
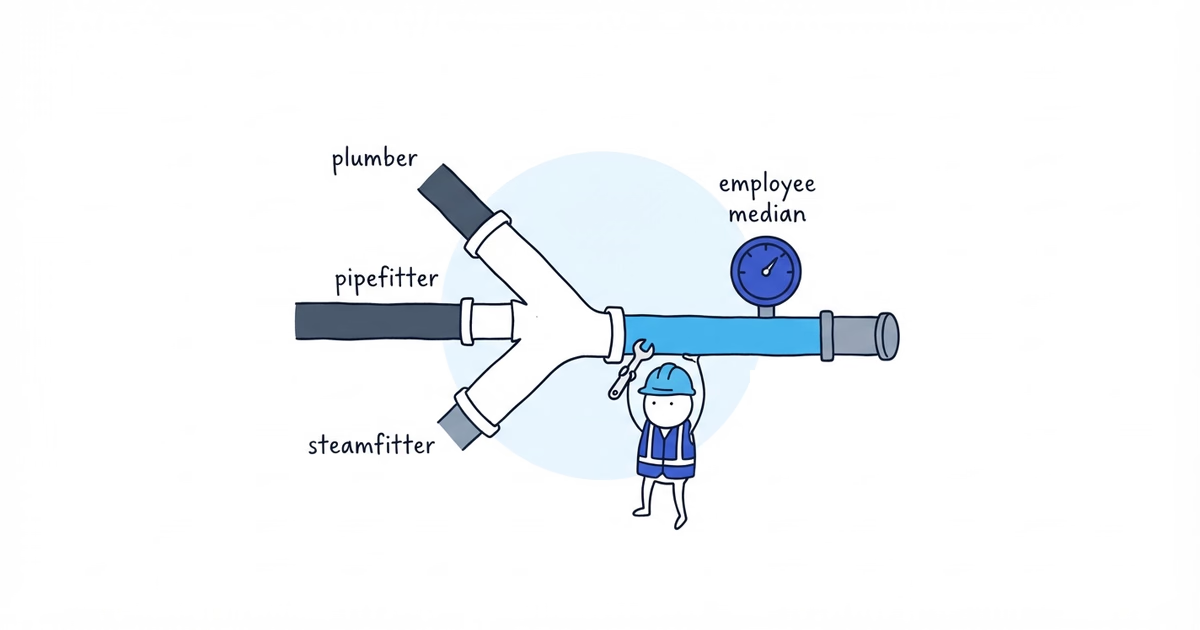
The official occupation is broader than the everyday word “plumber.” BLS combines plumbers, pipefitters, and steamfitters under SOC 47-2152. The figures below describe wage-and-salary jobs across all three related trades. They exclude self-employed plumbers and business owners, and they do not include overtime premium pay or employer benefits.
| Pay period | National median |
|---|---|
| Hourly | $30.67 |
| Weekly | $1,227 |
| Monthly | $5,317 |
| Annual | $63,800 |
The weekly and monthly values are simple conversions, not separate BLS observations. A plumber working irregular hours or earning overtime will not receive exactly those amounts.
What Is the Typical Plumber Pay Range?
The median is the most useful single benchmark, but plumbing wages cover a wide range. The 10th-percentile annual wage was $44,150, while the 90th-percentile wage was $108,420.
Those endpoints should not be relabeled as apprentice and master plumber salaries. BLS does not attach experience, license level, union status, or years in the trade to its national percentiles.
Plumber Wage Distribution
Source: U.S. Bureau of Labor Statistics, May 2025 OEWS, SOC 47-2152
Median pay versus average pay
The median of $63,800 means half of covered jobs paid less and half paid more. The mean, or arithmetic average, was higher at $72,170 per year and $34.70 per hour. A smaller number of highly paid jobs can pull the average upward, so the median usually gives a cleaner answer to what a plumber typically earns.
Which States Pay Plumbers the Most?
The District of Columbia had the highest state-equivalent median at $101,020, followed by Illinois at $99,950 and Oregon at $97,050. Minnesota, Alaska, and Massachusetts also had medians above $93,000.
Highest Median Plumber Pay by State
Source: U.S. Bureau of Labor Statistics, May 2025 OEWS, SOC 47-2152. Nominal wages, not adjusted for cost of living.
These are nominal wages. Housing, taxes, commuting costs, licensing rules, union coverage, and the mix of commercial, industrial, and residential work differ by state. A higher state median does not automatically produce greater buying power.
Plumber salary by state
| State | Median hourly | Median annual |
|---|---|---|
| Alabama | $28.21 | $58,670 |
| Alaska | $45.15 | $93,920 |
| Arizona | $29.84 | $62,070 |
| Arkansas | $23.39 | $48,660 |
| California | $35.01 | $72,830 |
| Colorado | $30.40 | $63,240 |
| Connecticut | $37.16 | $77,280 |
| Delaware | $31.11 | $64,720 |
| District of Columbia | $48.57 | $101,020 |
| Florida | $25.44 | $52,910 |
| Georgia | $27.50 | $57,200 |
| Hawaii | $37.53 | $78,060 |
| Idaho | $25.18 | $52,380 |
| Illinois | $48.05 | $99,950 |
| Indiana | $36.69 | $76,320 |
| Iowa | $30.72 | $63,890 |
| Kansas | $31.36 | $65,220 |
| Kentucky | $30.84 | $64,160 |
| Louisiana | $30.62 | $63,680 |
| Maine | $30.77 | $64,000 |
| Maryland | $31.44 | $65,400 |
| Massachusetts | $45.14 | $93,880 |
| Michigan | $38.56 | $80,190 |
| Minnesota | $45.39 | $94,410 |
| Mississippi | $26.67 | $55,480 |
| Missouri | $32.11 | $66,790 |
| Montana | $38.44 | $79,960 |
| Nebraska | $29.31 | $60,970 |
| Nevada | $29.62 | $61,610 |
| New Hampshire | $32.12 | $66,810 |
| New Jersey | $37.61 | $78,240 |
| New Mexico | $29.54 | $61,440 |
| New York | $37.26 | $77,490 |
| North Carolina | $27.44 | $57,080 |
| North Dakota | $30.56 | $63,560 |
| Ohio | $30.45 | $63,330 |
| Oklahoma | $27.87 | $57,970 |
| Oregon | $46.66 | $97,050 |
| Pennsylvania | $32.73 | $68,080 |
| Rhode Island | $36.77 | $76,470 |
| South Carolina | $25.93 | $53,940 |
| South Dakota | $24.82 | $51,620 |
| Tennessee | $28.17 | $58,600 |
| Texas | $28.77 | $59,840 |
| Utah | $29.76 | $61,900 |
| Vermont | $29.89 | $62,170 |
| Virginia | $29.07 | $60,470 |
| Washington | $38.96 | $81,030 |
| West Virginia | $27.39 | $56,980 |
| Wisconsin | $39.04 | $81,210 |
| Wyoming | $30.01 | $62,410 |
What Changes a Plumber’s Pay?
Location and work market. State medians reflect different construction markets, industrial activity, labor supply, and collective bargaining coverage. Compare nearby employers and projects rather than assuming the statewide median is the offer you will receive.
Apprenticeship and license progression. Apprentices generally build supervised hours before qualifying for a journey-level license, but requirements and titles vary by jurisdiction. License progression can open access to a wider range of work and responsibility. It does not guarantee a nationally fixed raise. If you need to prove supervised time, the apprentice-hours guide explains what to record and how to preserve supervisor evidence.
Work type and responsibility. Residential service, commercial construction, industrial piping, steam systems, medical gas, estimating, supervision, and foreperson duties are different labor markets. The combined BLS occupation does not separate a national pay premium for each specialty.
Overtime and on-call work. Emergency callouts and long project weeks can lift gross earnings, but the OEWS wage estimate excludes overtime premiums and shift differentials. Ask an employer about scheduled hours, on-call rotation, travel time, and the overtime policy instead of projecting annual pay from the base rate alone.
How to Compare a Plumbing Job Offer
Put every offer on the same base before comparing it with the $30.67 national median. Start with the regular hourly rate and the number of paid hours the employer normally schedules. Then separate guaranteed pay from overtime, bonuses, per diem, or emergency callout income that may vary from week to week.
Ask whether travel between jobs, supply-house runs, training, and on-call standby are paid. Also account for health insurance, retirement contributions, paid leave, union dues, required tools, and vehicle costs. OEWS wages exclude employer benefits, so a lower base rate can still be the stronger total package if the employer covers meaningful costs.
Finally, use the local or state median as context rather than a target. Compare similar residential, commercial, or industrial roles in the same labor market. A $35 hourly offer equals $72,800 for 2,080 regular hours before overtime, but it does not guarantee that schedule or take-home amount.
Employee Wages Are Not Plumbing Business Owner Income
An employee salary pays for labor. A plumbing company’s collected revenue must also cover technicians, parts, vehicles, insurance, permits, callbacks, marketing, dispatch, and cash retained in the business.
If you are deciding what the company can pay its owner rather than what a plumber earns, the plumbing owner earnings guide models technician costs, overhead, owner compensation, and retained cash separately.
Frequently Asked Questions
How much do plumbers make per hour?
The national median for plumbers, pipefitters, and steamfitters was $30.67 per hour in May 2025. The mean was $34.70 per hour.
How much do plumbers make per year?
The national median annual wage was $63,800, equal to about $5,317 per month or $1,227 per week when divided evenly.
What is the plumber salary range?
The 10th-percentile annual wage was $44,150, the median was $63,800, and the 90th-percentile wage was $108,420. These percentiles are not official license or experience bands.
Which state pays plumbers the most?
The District of Columbia had the highest state-equivalent median at $48.57 per hour and $101,020 per year. Illinois was next at $48.05 per hour and $99,950 per year. The figures are not adjusted for living costs.
Sources
- plumber-salary
- plumber-hourly-pay
- plumbing
- salary-by-state
- skilled-trades
- apprenticeship